
Factsheet, Medical 2018
Downloads
Source: National Health Workforce Data Sets (NHWDS), 2018
There are two publications for the Medical Workforce in 2018. A detailed publication with information and associated commentary named “Doctors in Focus” as well as a summary publication containing quick tables of facts.
Doctors in Focus, 2018
Medical practitioners diagnose and treat physical and mental illnesses, disorders and injuries, recommend preventative action and refer patients to specialist medical practitioners, other health care workers, and social, welfare and support workers.
All medical practitioners must be registered with the Medical Board of Australia (MBA) and meet the MBA’s registration standards in order to practise medicine in Australia. To gain registration, medical practitioners must complete a minimum four year program in a university medical school accredited by the Australian Medical Council.
International medical graduates (IMGs) whose medical qualifications are from a medical school outside of Australia or New Zealand must meet the requirements for one of the assessment pathways (competent authority pathway, standard pathway or specialist pathway) to gain medical registration in Australia.
Summary
The 2018 Doctors in Focus provides information about Australia’s medical practitioners and explores key workforce aspects to assist readers with research, workforce planning and career planning. This document provides insights at both a macro and detailed level. Some high-level themes in this issue include:
- The Australian medical workforce is growing at a rate that exceeds population growth. Most medical practitioners work in clinical roles and a small proportion work in non-clinical roles such as administration, education and research. The medical workforce is changing slightly over time with higher proportions of females entering the profession. Male practitioners tend to work longer hours than female and younger practitioners work longer hours than older.
- The Australian medical workforce is distributed relatively evenly across the private and public sector and the bulk of the workforce are in hospitals and group private practices. The number working in solo private practice is decreasing.
- The number of practitioners has increased across all Modified Monash Model areas across Australia since 2015, although MM 1 areas still have more practitioners per 100,000 people and MM 5 areas have the least.
- The majority of new medical students are Australian although the growth in international students is strong.
- The proportion of specialists (other than General Practice) has increased over time, with the top six non-GP specialties (Anaesthesia, Emergency Medicine, Paediatrics and Child Health, Physician, Psychiatry, Surgery) accounting for most of this growth.
Figure 1: Medical Registrations, 2018
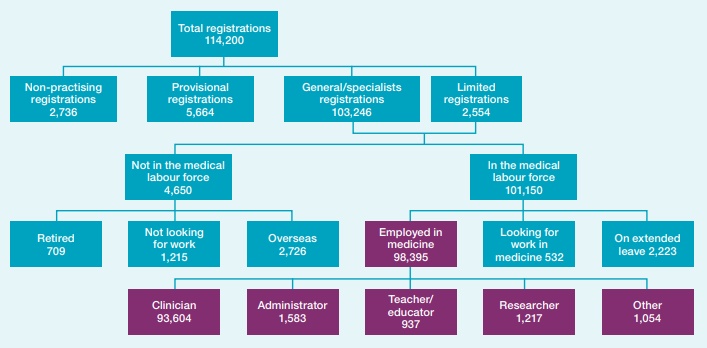
Figure 1: A tree chart splitting the workforce by registered status, labourforce status, employed status and clinician status
Figure 2: Quick Facts, 2018
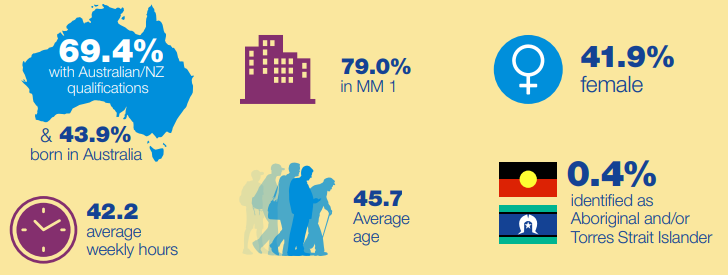
Figure 2: An infographic with figures for different metrics. 69.4% Australian/NZ qualifications, 43.9% born in Australia, 79.0% in MM1, 41.9% female, 42.2 average weekly hours, 35.7 average age, 0.4% identified as Aboriginal and/or Torres Strait Islander
Table 1: Registered medical practitioners, 2015 to 2018
| 2015 | 2016 | 2017 | 2018 | |
|---|---|---|---|---|
| Total registrations | 102,805 | 106,634 | 110,376 | 114,200 |
| Employed medical practitioners | 87,999 | 91,341 | 95,194 | 98,395 |
| Clinicians | 83,490 | 86,550 | 90,417 | 93,604 |
Source: National Health Workforce Dataset (NHWDS) 2015 to 2018
Table 2: Registered and employed medical practitioners, 2015 to 2018
| Type of practitioner | 2015 | 2016 | 2017 | 2018 |
|---|---|---|---|---|
| Clinicians | ||||
| General Practitioner | 27,519 | 28,352 | 29,455 | 30,066 |
| Hospital non-specialist | 9,755 | 9,709 | 10,516 | 10,759 |
| Specialist | 29,416 | 30,518 | 32,245 | 33,303 |
| Specialist-in-training | 14,965 | 16,158 | 16,334 | 16,916 |
| Other clinician | 1,835 | 1,813 | 1,867 | 2,560 |
| Non-clinicians | 4,509 | 4,791 | 4,777 | 4,791 |
| Total | 87,999 | 91,341 | 95,194 | 98,395 |